
GOOGL | Ads TAM

With OpenAI moving into ads - and platforms like TikTok becoming more aggressive on monetization - I’ve been thinking about what this means for the broader advertising landscape.
If online ads penetration is already approaching ~80%, does that imply growth must revert to GDP+, with existing incumbents like GOOGL 0.00%↑ and META 0.00%↑ inevitably losing share to new entrants?
That intuition turns out to be wrong.
AMZN 0.00%↑ quietly built a ~$70B ads business and became the “Big 3” without meaningfully impairing GOOGL 0.00%↑ or META 0.00%↑ - at least not in the aggregate numbers. Digging into AMZN 0.00%↑ as a case study forced me to revisit a flawed assumption: that ad growth must be capped by the traditional “advertising market” definition.
Bernstein has a useful framework that reframes the real TAM.
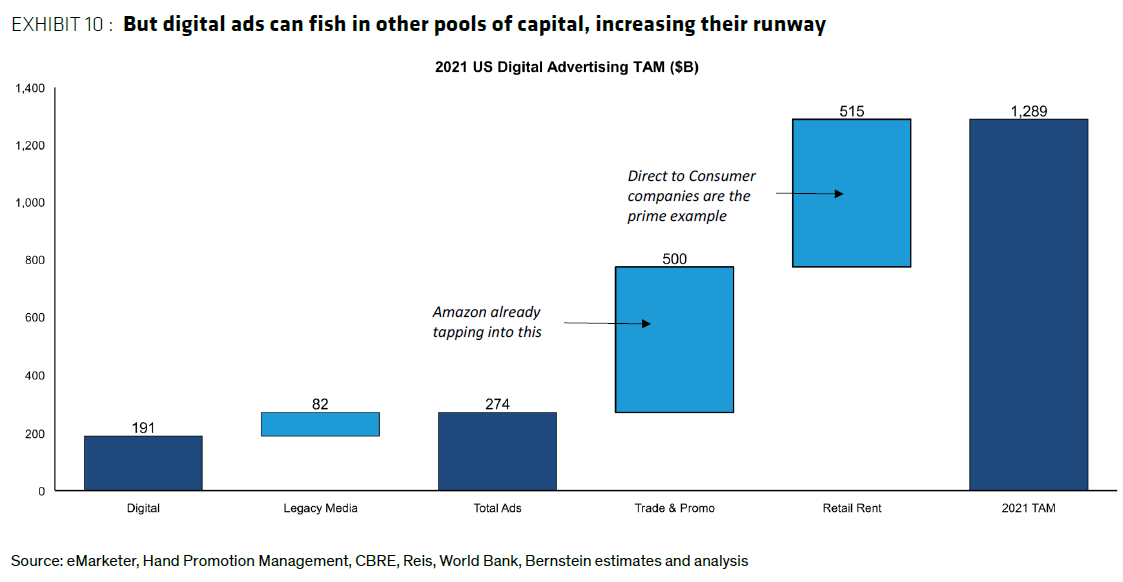
The key insight: AMZN 0.00%↑ ’s ads business is not primarily drawing from core advertising budgets. It is largely monetizing Trade & Promo spend.
Trade & Promo is typically controlled by a different buyer than marketing. It is often owned by product or category managers rather than the central marketing team. This is what’s traditionally called “below-the-line” spend - promotional pricing, product placement, coupons, endcaps, and shelf positioning. In accounting terms, it is booked as commercial spend, tied to retailers, customers, and near-term volume. Ads, by contrast, are booked as marketing or media spend, tied to reach, demand creation, and performance acquisition.
Quoting Mark Shmulik from Bernstein:
The common bear case - “digital is already ~80% of ads, so growth must revert to GDP+” - uses the wrong denominator. The pool of dollars that can flow into digital is much larger than the narrowly defined ad market.
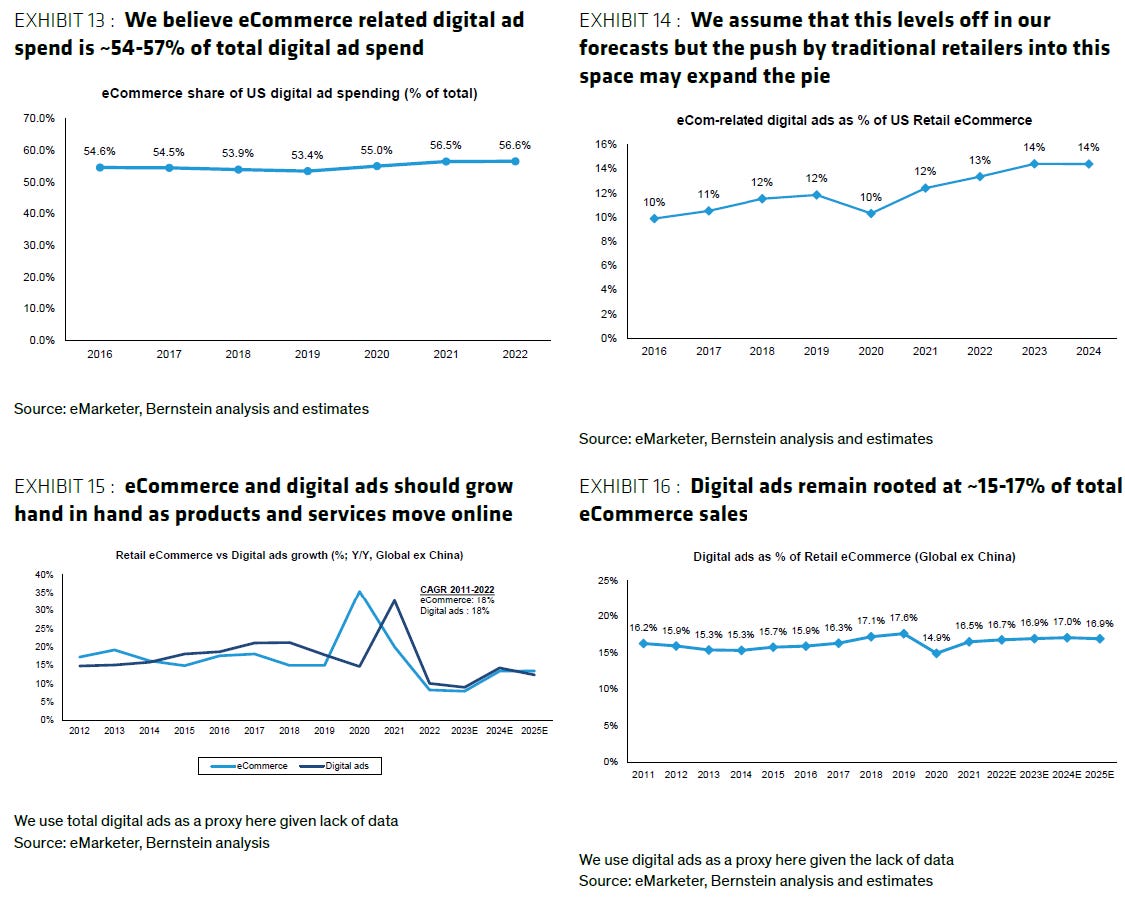
Digital advertising increasingly functions as a take-rate on commerce. As long as eCommerce penetration continues to rise (ex-China still only ~11%) and GMV keeps growing, the monetizable surface for digital ads expands alongside it. Amazon did not steal share from Google and Meta so much as unlock an adjacent budget that was never counted as “advertising” in the first place.
There are other underappreciated sources of runway.
Linear TV budgets are structurally stuck and represent a large reservoir of funds. In the US alone, the linear TV ad market still generates roughly $60B–$70B annually.
Services are also under-digitized relative to their economic weight. Services account for ~66% of PCE and ~60% of total ad spend, yet only ~40% of digital ad spend. As more service discovery, booking, and transactions move online, digital services advertising has room to expand meaningfully.
The takeaway is straightforward: fears around “digital ads saturation” tend to recur because we keep anchoring on an outdated definition of the market. AMZN 0.00%↑’s ads business demonstrated that the TAM is not fixed - and today’s next wave of platforms may be tapping into similarly misclassified pools of spend.
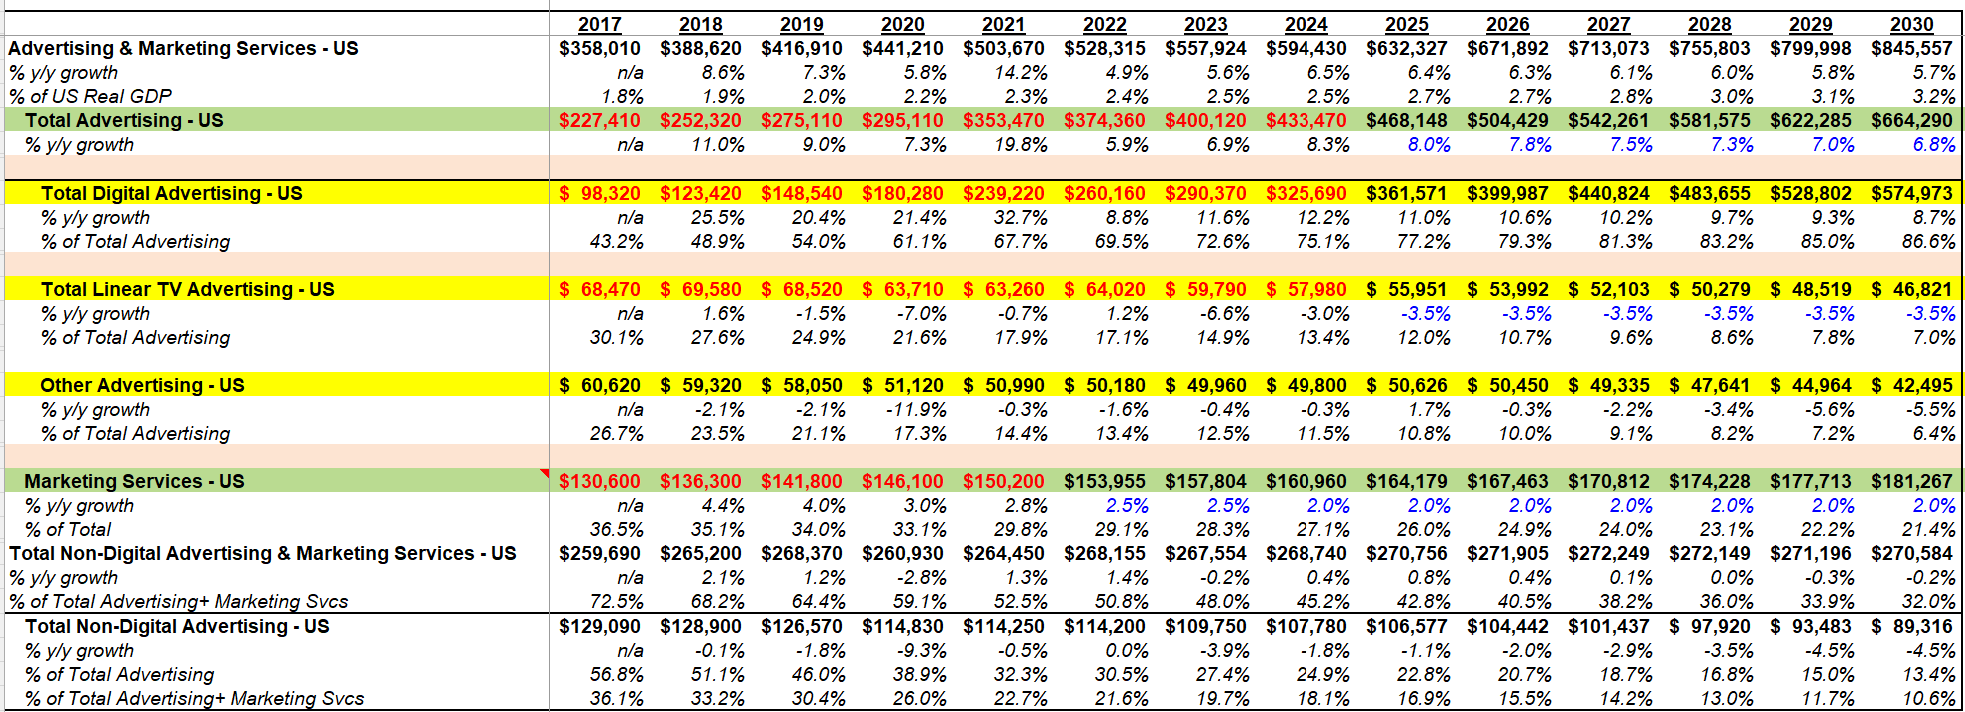
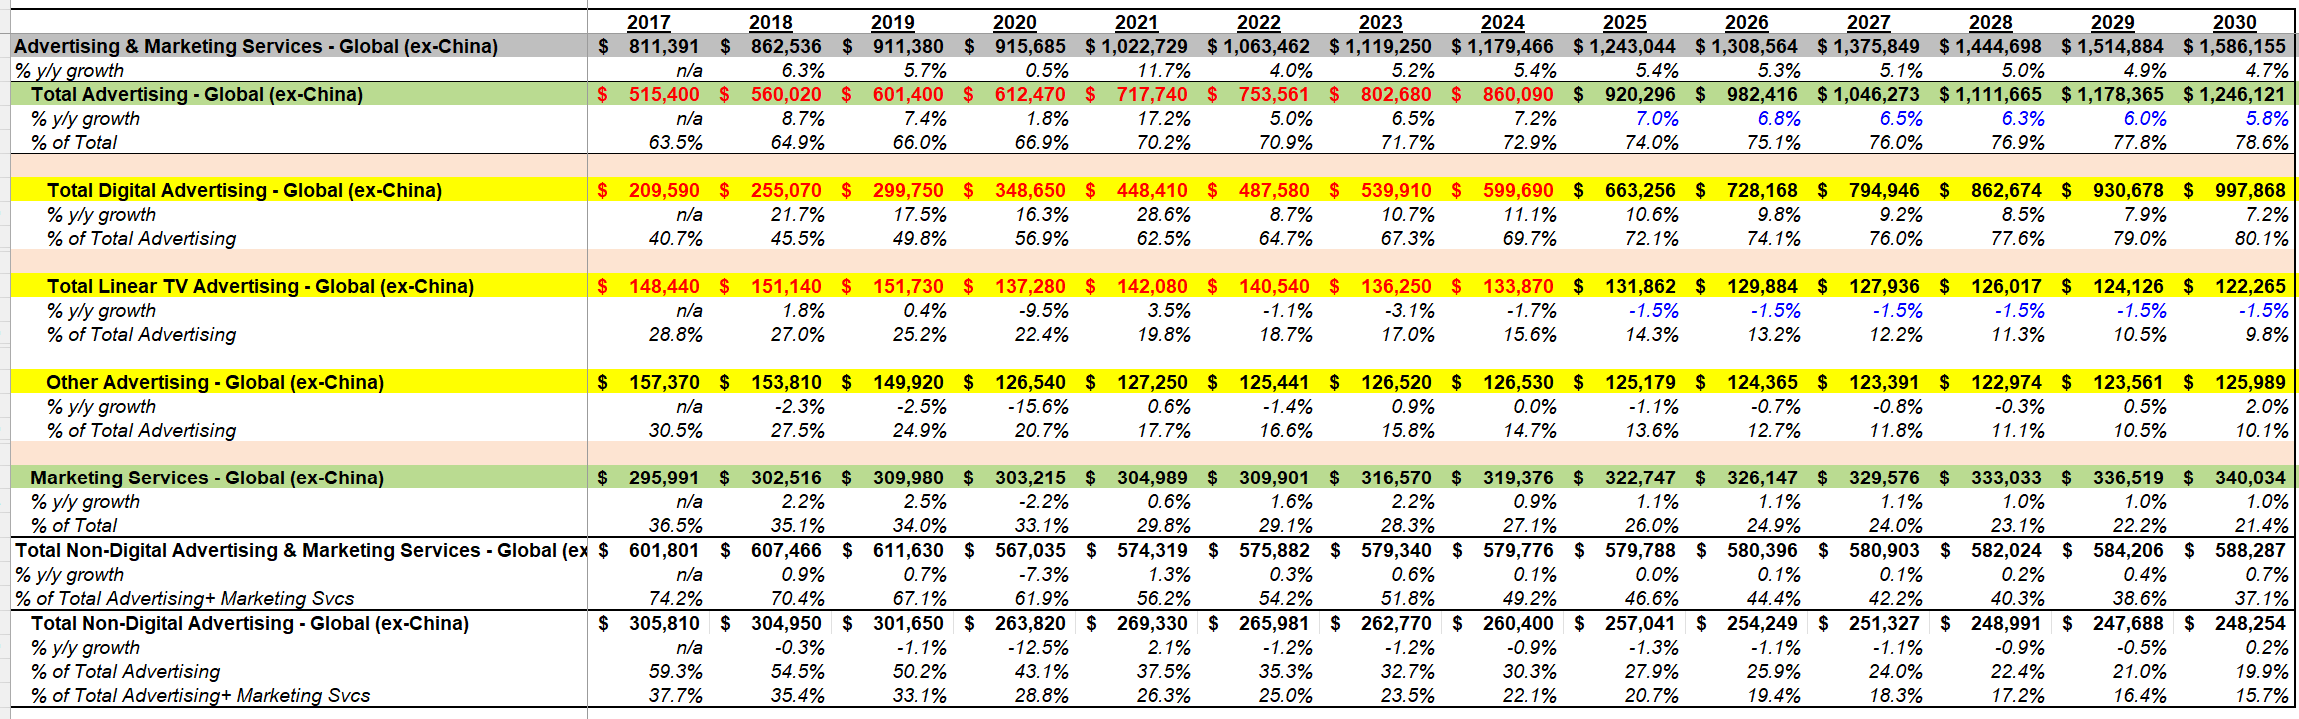
TAM (GS Model)
US -
Global -
Ecomm <> Ads
Source: Bernstein repor
Source:
The Long View: Digital advertising -- An updated outlook, Bernstein, 1/24/2023
GS Ads Model
Regarding the expanding TAM: I think the next wave of 'found money' for platforms will come from cannibalizing Ad Agencies. Tools like Advantage+ are essentially insourcing the work of intermediaries. If platforms can capture the margin that brands previously paid to agencies for optimization and operations, that's another structural lift to the digital ads TAM that isn't dependent on GDP.
China's e-commerce penetration rate is 26.1%—seen in that light, the advertising wallet is even bigger.